Which gamma lines matter most, what each one is for, and real examples from my own trades. Today's levels are at the bottom.
New to gamma? Start with what gamma levels are. In one line: they show where big options positions sit, and dealers' hedging around those prices can slow price down, turn it, or speed it up.
The ranking: which lines matter most
| Rank | Level | What it is | Use it for |
|---|
| 1 | Call Resistance / Put Support | The strikes with the most call gamma above price and the most put gamma below it | The main walls. Where to look for reactions |
| 2 | 1D Max / 1D Min | The day's expected range, from option prices | Stops and targets. Spotting stretched moves |
| 3 | HVL (zero gamma) | Where dealer hedging flips from calming to fuelling | The mood of the day. Below it, moves run further |
| 4 | GEX 1–5, next-expiry levels | Smaller gamma clusters near price | Pauses and small turns. Weaker on their own |
Why the top two matter most: that's where dealers hold the biggest positions, so it's where they have to hedge the hardest. They usually sit on big round strikes too (4,100 and 4,200 on gold futures), where lots of traders hold options anyway.
Example 1: Call Resistance caps a rally
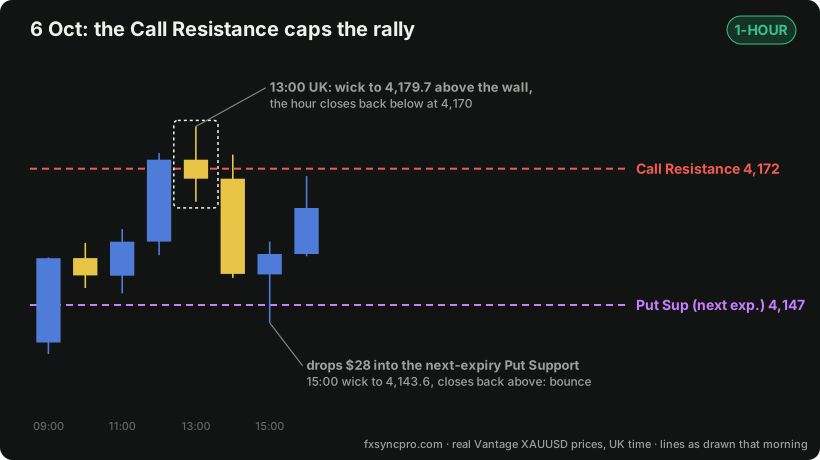
On 6 October gold rallied into the Call Resistance at 4,172. The 13:00 UK hour poked through to 4,179.7 but closed back below. Price then fell $28 to the next-expiry Put Support at 4,147, wicked under it and closed back above. I bought that bounce for 1.1R (journal).
How to use it: a wick through a wall that closes back on the 1-hour is the signal. A wick on its own isn't. Wait for the close.
Example 2: Put Support and the 1D Min stop a sell-off
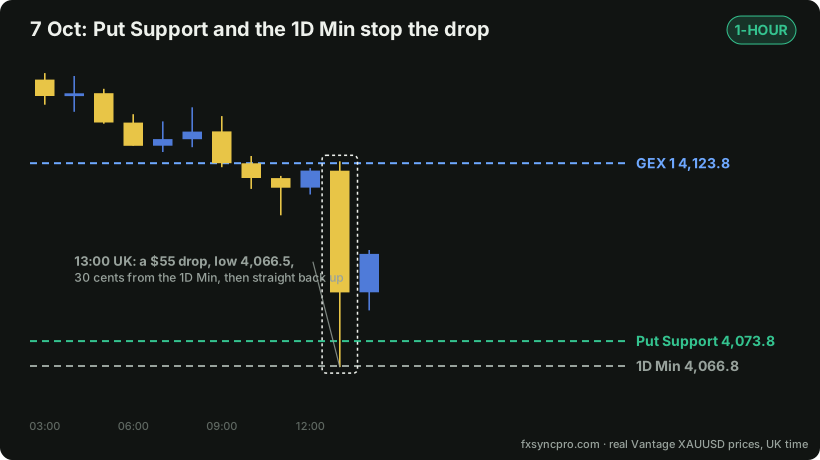
On 7 October gold broke my support levels one after another and dropped $55 in one hour. It stopped at 4,066.5: under the Put Support (4,073.8) and 30 cents from the 1D Min (4,066.8). Two gamma levels $7 apart made a floor.
How to use it: on a fast, stretched move into a wall, a limit order at the wall with the stop beyond the 1D Min can beat waiting for the close (by the time this hour closed, price was already $13 higher). I made 2R this way. Full write-up: how I use gamma levels for limit orders.
Example 3: when a wall breaks
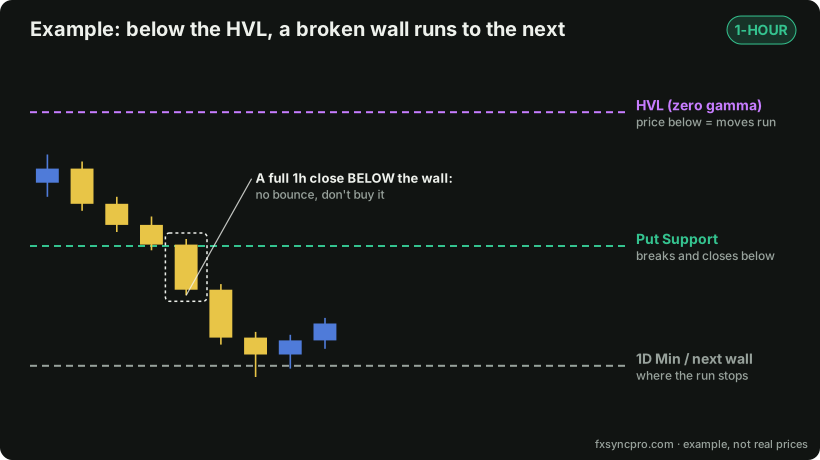
Walls don't always hold. When price is below the HVL, dealer hedging runs with the move. If a 1-hour candle closes fully through a wall, it often keeps going to the next level (the 1D Min, or the next gamma line) instead of bouncing.
How to use it: don't buy a Put Support that has already closed below. Look to the next level down instead, and use your stop as normal.
A simple checklist
- Check the timestamp. Levels are recalculated every day. Yesterday's wall can move.
- Find the two walls (Call Resistance and Put Support) and the 1D range. That's the map for the day.
- Check the mood: price above the HVL tends to range, below it tends to trend.
- Wait for the reaction: a 1-hour wick through and a close back. Or, on a fast stretched move, a limit at the wall with the stop past the next gamma level.
- Extra confidence when a wall sits on one of my own levels, or two gamma levels sit close together.
- A full close through a wall below the HVL means it broke. Don't fade it.
Our own calculation, converted to my broker's prices (Vantage). Updated with every session markup.