Gamma levels on gold: what they are and how I use them as confluence
By Jason · 1 October 2026
A lot of traders talk about “gamma levels” or “GEX” as if they’re a secret map of where price will turn. I’ve started testing them on gold this week, so here’s what they actually are, where the numbers come from, and how I’m using them. Honestly, as confluence, not as a strategy on their own.
What gamma levels are, in plain English
Big banks and dealers sell a huge number of options on gold futures. To stay neutral, they have to hedge by buying or selling gold futures as the price moves. How much they need to hedge depends on something called gamma, and it’s biggest at the strike prices where lots of options are open.
So a strike with a large pile of open options can become a place where dealer hedging pushes back against price, or pulls price towards it. Gamma levels are just a way of showing where those piles are.
Where the data comes from
CME, the exchange where gold futures and options trade, publishes the open interest for every gold option strike once a day, for free. That’s what everyone uses, including the paid services.
Two honest limits:
- It’s only published once a day, some hours after the US close. So the levels are always based on the previous day’s positions.
- Nobody knows exactly which side the dealers are on. The usual assumption (and mine) is that dealers are long the calls and short the puts that customers trade. Paid services try to refine this with trade-by-trade data.
I convert everything from futures prices to my broker’s gold price (spot gold usually sits about $30 below the December futures contract right now), so the lines sit in the right place on my chart.
What each level means
| Level | What it means | How it tends to act |
|---|---|---|
| HVL (zero gamma) | The line where dealer hedging flips from calming to amplifying | Tells you the type of day more than where to trade |
| Call Resistance | The strike above price with the most call gamma | Often a strong ceiling |
| Put Support | The strike below price with the most put gamma | Often a strong floor; can speed up a drop if it breaks |
| GEX 1–5 | The strikes with the most gamma near price | Places where price stalls, turns or gets pulled to |
| Next-expiry levels | The same, only for the options expiring soonest | Matter most just before that expiry |
| 1D Max / 1D Min | The day’s expected range, from option prices | Good for spotting stretched moves and realistic targets |
The HVL is the one that sets the mood
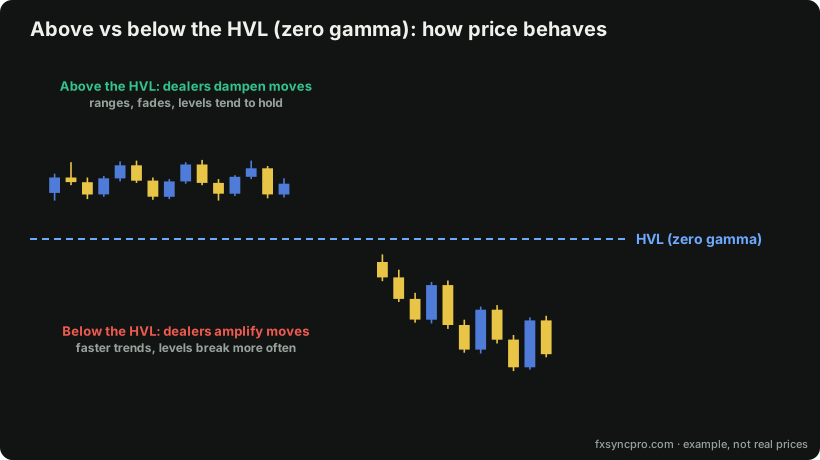 Above the HVL, dealer hedging calms price down. Below it, hedging adds fuel.
When price is above the HVL, dealers hedge by selling rallies and buying dips, which tends to keep price in a range. When price is below the HVL, their hedging runs with the move, so trends are faster and levels break more often. This week gold has been well below it, which fits the big swings.
How I actually use them: confluence only
I don’t trade from gamma levels. I trade my own zones, marked up before every session from the daily and weekly charts (here’s the full method). The gamma lines are a second opinion:
- A gamma level on top of one of my zones = a stronger zone. Two completely different reasons for the same price.
- Below the HVL, be careful fading moves. A break is more likely to keep going.
- The 1D Max/Min tells me when a move is already stretched, or when a target is unrealistic for the day.
- The 1-hour candle matters. A 1-hour wick through a gamma level that closes back on the other side is a strong rejection, and one I’m watching closely.
Three real examples from this week
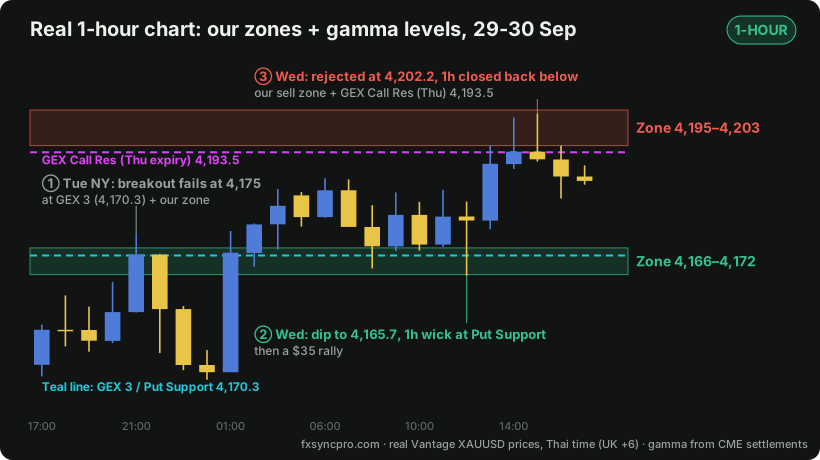 Real prices. The gamma levels were published before each move, not drawn afterwards.
- Tuesday, New York: gold broke above my 4,160–4,171 zone, but the breakout failed at 4,175, right on top of GEX 3 (4,170.3), and dropped back into the zone.
- Wednesday, Asia: a dip to 4,165.72, a 1-hour wick into my 4,166–4,172 zone and the Put Support at 4,170.3, then a $35 rally.
- Wednesday, London: a rally into my 4,195–4,203 sell zone, where the soonest-expiring options had their call resistance at 4,193.5. It topped at 4,202.25 and the 1-hour candle closed back below the zone. The sell played out.
What I don’t know yet
Three good examples are encouraging, but they prove very little:
- All three were on my own zones as well. So far gamma is confirming my levels, not adding new ones. The real test is gamma levels that sit on their own.
- A simple mechanical version doesn’t work. When I tested “any 1-hour wick at a round-number strike, trade the next hour” on three years of data, it was a coin flip. Whatever edge there is needs the real daily levels plus judgement: trend, context and a clean wick.
- The data is always a day old, and it’s an estimate of dealer positioning, not a fact.
So I’m forward testing it: every time price reacts, or doesn’t, at a gamma level, it goes in my trading journal. In a few weeks I’ll post the honest scorecard, good or bad.
Should you use gamma levels?
If you already trade levels, gamma can be a useful second opinion, especially the HVL for the type of day and the big put and call walls. If you’re looking for a magic line to trade on its own, this isn’t it, and anyone selling it that way is overselling.
You can see my current gamma levels (marked “GEX”, refreshed every day) alongside my zones on my public TradingView chart: it’s view-only, and you can copy it to your own TradingView. The newsletter sends my zones before every session, and the journal shows how they (and the gamma levels) actually play out.
This is my own testing and my own trading, not financial advice. Options data is an estimate of positioning, and trading CFDs and forex is high risk. Most retail traders lose money.