Gold's biggest rallies and crashes in history, and what caused them
By Jason · 16 October 2026
Gold has a reputation as the “safe” asset. Its history says otherwise. It has gone up more than 20 times in a decade, then lost two-thirds of its value and taken over 40 years (after inflation) to get back. Its biggest crashes came in days.
Here are the big moments, what caused them, and what they teach anyone trading gold today.
1971: the day gold was set free ($35)
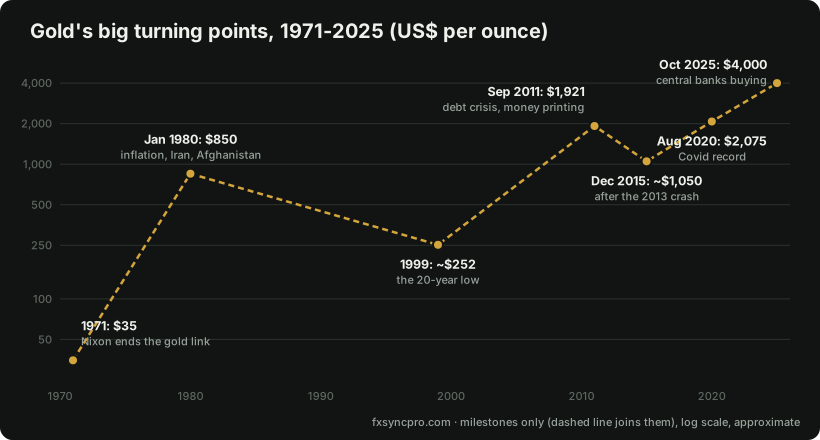
For decades, the US dollar was tied to gold at $35 an ounce: other countries could swap their dollars for US gold at that price. By 1971 there were far more dollars than gold to back them, and countries were lining up to swap.
On 15 August 1971, President Nixon “closed the gold window”: dollars could no longer be swapped for gold. For the first time in modern history, gold’s price was free to float.
1980: the first mania ($35 to $850)
The 1970s were the perfect storm for gold:
- Inflation in the US hit double digits. Cash was losing value fast.
- Two oil shocks sent prices through the roof.
- In 1979, the Iranian revolution and the Soviet invasion of Afghanistan put the world on edge.
Gold went from $35 to a peak of about $850 in January 1980, more than 20 times higher in under a decade. In the final weeks, it rose hundreds of dollars as people queued outside dealers to buy.
1980-1999: the long crash (down to about $252)
Then the man who ended the party arrived: Paul Volcker, head of the US central bank. To kill inflation, he pushed interest rates to around 20%.
When cash in the bank pays 20%, a lump of metal that pays nothing looks a lot less attractive. Gold fell over 60% within two years, then drifted lower for nearly two decades, bottoming at about $252 in 1999.
That same year, the UK began selling more than half of its gold reserves, near the bottom, at an average of about $275. It’s still known as “Brown’s Bottom”, after Gordon Brown, the Chancellor who ordered it.
Adjusted for inflation, gold didn’t get back above its 1980 peak until 2024-2025, more than 40 years later.
2001-2011: the second great rally (to $1,921)
Gold’s comeback came in stages:
- After the dot-com crash and 9/11, interest rates were cut hard.
- The 2008 financial crisis pushed rates to near zero, and central banks started printing money (quantitative easing) on a huge scale.
- In 2011, the euro debt crisis and the US losing its AAA credit rating sent investors running for safety.
Gold hit $1,921 in September 2011, more than seven times its 1999 low.
April 2013: the crash in two days
On 12 and 15 April 2013, gold dropped about $200, around 13%, in two trading days. It was the biggest two-day fall in about 30 years.
The triggers piled up: talk that the US would soon stop printing money, fears that struggling countries like Cyprus would sell their gold, and then a wave of huge sell orders in the futures market that tripped stop-losses one after another. Each wave of stops fed the next.
Gold lost about 28% that year and kept sliding to around $1,050 by the end of 2015.
March 2020: when even gold got sold
When Covid hit, almost everything crashed at once, including gold. In a few days in March 2020, it fell about 12%.
Why would a “safe haven” fall in a panic? Because when funds and banks face huge losses elsewhere, they need cash, and they sell whatever they can, including their winners. Traders call it a “dash for cash”.
Once central banks flooded the system with money, gold flew: a new record of $2,075 in August 2020.
2022-2025: the central bank era (to $4,000)
The latest rally has a different driver: central banks themselves.
After Russia’s central bank reserves were frozen in 2022, many countries decided they wanted reserves no other country could freeze. Central banks bought over 1,000 tonnes of gold a year in 2022 and 2023, the most since records began. China, Poland, India and Turkey were among the biggest buyers.
Add wars, worries about US debt and interest rates finally coming down, and gold broke record after record: $3,000 in March 2025 and $4,000 in October 2025.
The 4 lessons that still move gold today
| Lesson | Then | Now |
|---|---|---|
| 1. Interest rates matter most | Volcker’s 20% rates crushed gold for 20 years | Watch US rate decisions and inflation data (CPI). Rate cut hopes = gold up |
| 2. Fear drives rallies | Iran 1979, 2011 debt crisis | War and crisis headlines still spark sharp spikes |
| 3. Forced selling causes crashes | April 2013, March 2020 | When stops cluster, moves feed themselves. It’s why I use gamma levels to see where hedging can speed price up |
| 4. Big buyers set the trend | Central banks since 2022 | The long-term trend follows who’s buying the physical metal (who sets the gold price) |
What this means for a day trader
You don’t need to predict the next decade to trade gold today. But history explains why gold behaves the way it does:
- It can move hundreds of dollars in days when everyone heads for the same exit. Always use a stop.
- The biggest single-day moves cluster around US interest-rate news. That’s why I don’t open trades 15 minutes either side of high-impact news.
- Even in a long-term uptrend, gold has sharp falls. A great long-term story doesn’t make every dip a buy.
Educational only, not financial advice. Prices are approximate historical figures.