My 1-hour and 4-hour rejection strategy: A+ and A setups explained
By Jason · 3 October 2026
For my first few weeks I traded gold the way most people start: 5-minute and 1-minute charts, waiting for the perfect little pullback. It worked sometimes. But it was noise. Every wick looked like a signal, every signal needed watching, and I spent hours staring at candles that meant nothing.
Then I started taking a different kind of trade, almost as a side test, and it quietly became the only thing I want to trade. This is that strategy.
The idea in one sentence
Wait for a 1-hour candle to wick through a strong level and close back on the other side, then trade the next hour.
That’s it. No indicators, no 1-minute timing. The candle close does the work.
What a rejection is
A level is a price where the market has turned before: a weekly high or low, a swing point that held for months. (How I pick them is in how I trade key levels.)
A rejection is when price pushes through that level, the market says “no”, and the candle closes back where it came from:
- At support: the candle’s wick goes below the level, but it closes above it.
- At resistance: the wick goes above, but it closes below.
The wick shows sellers (or buyers) tried and failed. The close confirms it. Until the candle closes, it isn’t a rejection; it’s just a move.
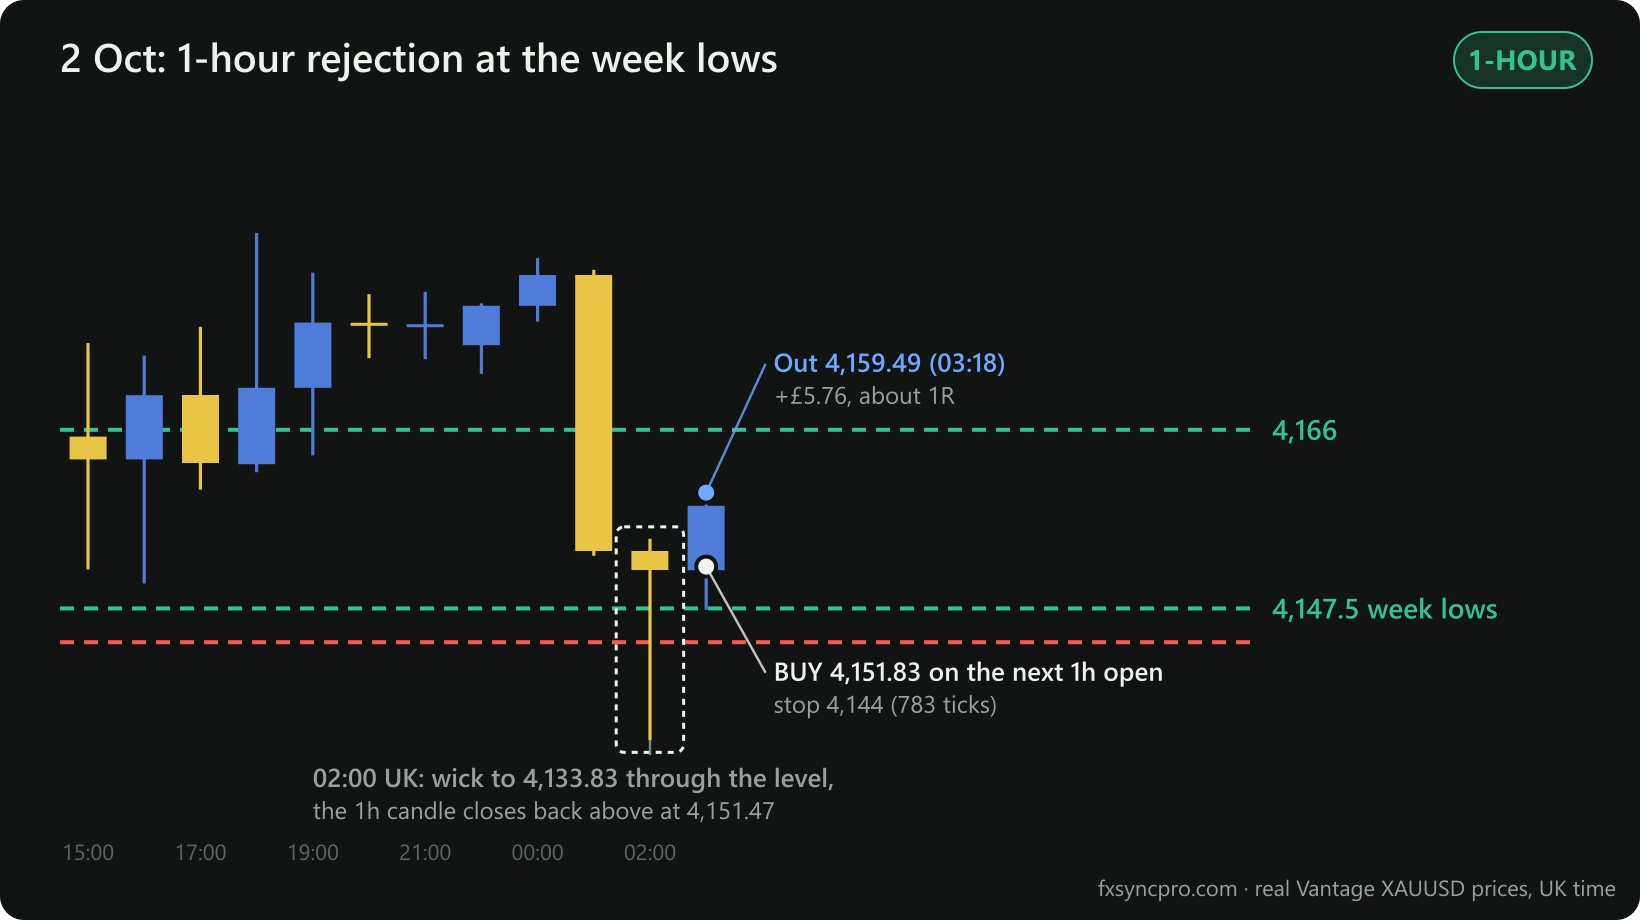 A real one, 2 October: the wick went $14 through 4,147.5, the hour closed back above it, and the next hour paid 1R.
A and A+: how I grade them
Not every rejection is equal. I grade them before I take them.
A setup: the 1-hour on its own
- A strong level (never a medium one: I lost a trade on 2 October breaking exactly this rule).
- The 1-hour candle wicks through and closes back.
- Target: 1R (the same distance as my stop).
A+ setup: everything lines up
- A strong level with a gamma level in the same area (the price zones where big options positions sit, which I explain in gamma levels on gold).
- The 4-hour candle and the 1-hour candle that close at the same time both wick through and close back.
- Target: 2R, or I leave the target open and trail my stop.
The 4-hour and 1-hour close together six times a day. On my TradingView chart that’s 03:00, 07:00, 11:00, 15:00, 19:00 and 23:00 UK in summer time (an hour earlier once the clocks go back). When both reject the same level at the same close, at a level where the options market is also stacked, that’s as good as this strategy gets.
Entry, stop and target
Entry: the open of the next 1-hour candle after the rejection closes. No guessing inside the candle.
Stop: beyond the level, not beyond the whole wick. On the 1-hour and 4-hour, wicks are often $15–20 on gold. A stop under the entire wick would mean risking double or triple what I’m comfortable with, and I’d be waiting weeks for a trade. So the stop goes a little beyond the level itself, and it’s never more than $8 on gold (800 ticks at 0.01 lots). If it would need to be wider, I skip.
On Bitcoin the stop is wider in dollars, so I size the trade down instead: lots = the risk I want ÷ the stop distance. (How to size a Bitcoin trade has the full table.)
Target: 1R for an A, 2R (or a trailing stop) for an A+.
My results so far, honestly
Every trade is in my journal, wins and losses, with the charts.
| Date | Market | Trade | Result |
|---|---|---|---|
| 30 Sep | Gold | Sell, 1h rejection at a gamma level after Core PCE | +1.0R, +£10.01 |
| 1 Oct | Gold | Buy, 1h rejection at a gamma level inside a strong zone | +1.8R, +£7.96 |
| 1 Oct | Bitcoin | Sell, 1h rejection at a strong zone | +1.0R, +£2.13 |
| 1 Oct | Bitcoin | Sell, 1h rejection at a gamma level | +1.4R, +£5.99 |
| 2 Oct | Gold | Buy, 1h rejection at this week’s lows | +1.0R, +£5.76 |
Five out of five. That’s encouraging, but five trades proves nothing: a coin can land heads five times in a row. I’ll keep logging every one, and I’ll judge it properly after 30 to 50 trades.
Why I prefer it
- Less screen time. I check the chart when an hour closes, not every minute.
- Less noise. A 1-hour close carries far more weight than a 1-minute wiggle.
- Clear rules. Strong level, wick through, close back, next open, stop beyond the level. Either it happened or it didn’t.
- It’s patient by design. Some days there’s nothing. That’s fine. Waiting is a position too.
How I share it
Before each session I post the levels and the possible setups for this strategy on my Telegram channel and on the levels page: which strong levels are in play, where gamma lines up (the potential A+ setups), and what has to close where before it counts. The levels are pinned to my chart with a timestamp, so you always know they’re current.
Real trades on my own live account at small size (0.01 lots). This is how I trade, not financial advice.