How I trade gold at key levels: my full strategy, step by step
By Jason · 29 September 2026
This is the exact way I trade gold (XAUUSD), from marking up the chart before the session to getting out of the trade. No indicators, no signals, no secret sauce. Just price levels that matter, and a strict set of rules for trading them.
A quick bit of honesty first: I’ve only been trading this way on a live account for a few days, at 0.01 lots, and every trade is in my journal, wins, losses and the trades I skipped. It’s not a proven system yet. I’m sharing it because the method is simple, and writing the rules down in public keeps me disciplined.
Why levels?
Gold doesn’t move randomly between prices. It stalls, reverses and breaks out at the same areas again and again: old highs and lows, places where buyers or sellers stepped in before. Traders, banks and algorithms all watch those same areas, so that’s where the big orders sit.
If you only trade at those levels, three good things happen:
- You know exactly where you’re wrong, so your stop has a logical place.
- You know where price is likely to stall next, so your target is realistic.
- You stop taking random trades in the middle of nowhere.
Part 1: Marking up the levels
I do this before every session, and it’s the most important part. If the levels are wrong, everything after is guesswork.
Timeframes
- Daily and weekly charts to find the levels (looking back weeks to months, not just today).
- 1-hour for the direction: is price making lower highs (bearish) or higher lows (bullish)?
- 5-minute for the signal.
- 1-minute for the exact entry.
Where levels come from
- Weekly highs and lows: the strongest of all.
- Daily highs and lows: yesterday’s, and older ones price keeps coming back to.
- Swing points: places where price turned sharply, even months ago.
- Flip levels: old support that broke and now acts as resistance (or the other way round).
- Gaps: for example Friday’s close vs Monday’s open.
- Round numbers (like 4,100 or 4,200), but only when they line up with one of the above. On their own they’re weak.
Zones, not lines
Price rarely turns at the exact same cent. So I mark zones, usually $3–10 wide on gold: from the lowest to the highest reaction in that area. For example, 4,160–4,166 instead of “4,163”. Draw them as boxes. A single line in the middle makes you think price “missed” the level when it actually reacted right on it.
Rating every level: strong, medium or weak
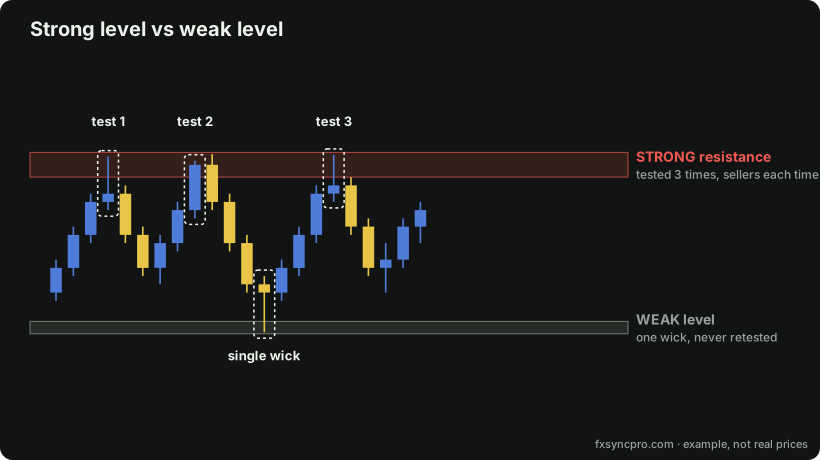 Three clear reactions make a level strong. One wick doesn’t.
- STRONG: tested 2+ times with clear reactions, a daily or weekly high/low, a flip level, or several of these in the same zone.
- MEDIUM: one clean reaction, or an intraday session high/low.
- WEAK: untested, a single wick, or a round number on its own.
Strong levels give the best reaction trades. Weak levels tend to break. I only look for trades at strong and medium levels.
One trap I fell into myself: today’s live low (or high) is not a level yet. If price is sitting on it right now, nobody has reacted there. It only becomes a level once price has bounced clearly away from it.
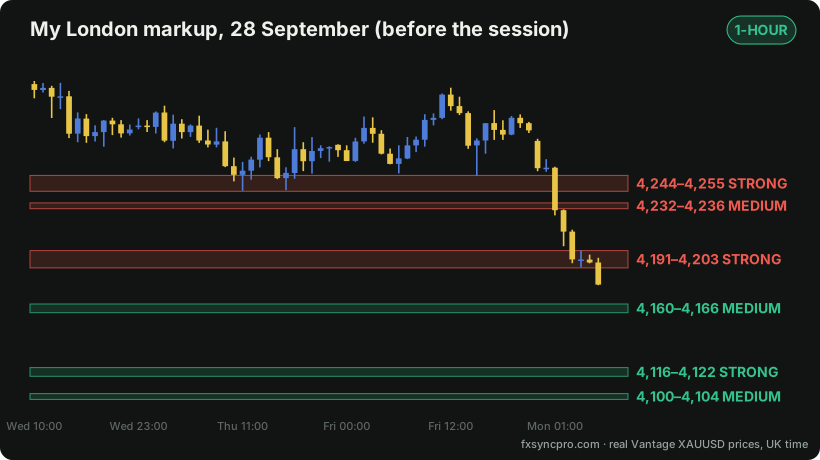 My actual London markup on 28 September, drawn from real prices. Every zone has a range and a strength.
Part 2: The two setups I trade
I only trade two things at a level. Everything else, I leave alone.
Setup 1: Break and retest
The level breaks, price comes back to test it from the other side, and it holds. I use two charts for this: the 5-minute tells me the trade is on, the 1-minute tells me when to get in. (Shown as a sell; the buy is the mirror image.)
Step 1, on the 5-minute: the break and the retest.
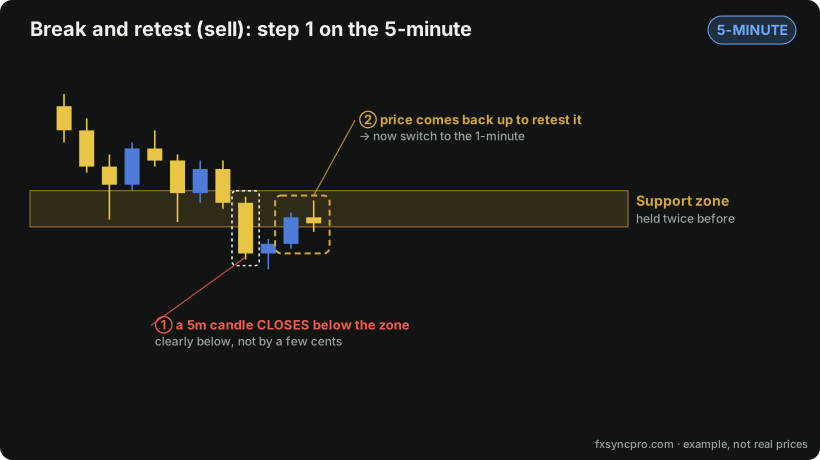 The 5-minute: a clean close below the zone, then a retest from below.
- A 5-minute candle closes through the level. Closed, not just poking through. And it has to close clearly through: a few cents past the level is a touch, not a break. On gold I want about $1.50 beyond it.
- Price comes back to test the level from the other side. That’s when I switch to the 1-minute.
Step 2, on the 1-minute: the entry.
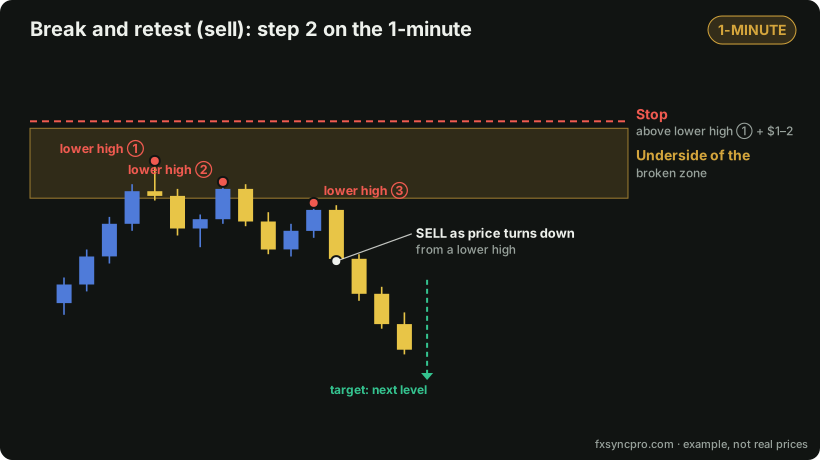 The 1-minute: lower highs under the broken zone. The sell is taken as price turns down.
- Wait for a lower high (for a sell) or a higher low (for a buy) as price tests the level, then enter as it turns away. The stop goes above that lower high plus a dollar or two.
Setup 2: Rejection (the failed breakout)
Price pushes into a strong level, pokes through it, then gets slammed back. The people who bought the breakout are now trapped, and that often fuels a strong move the other way.
Step 1, on the 5-minute: the wick and the close back.
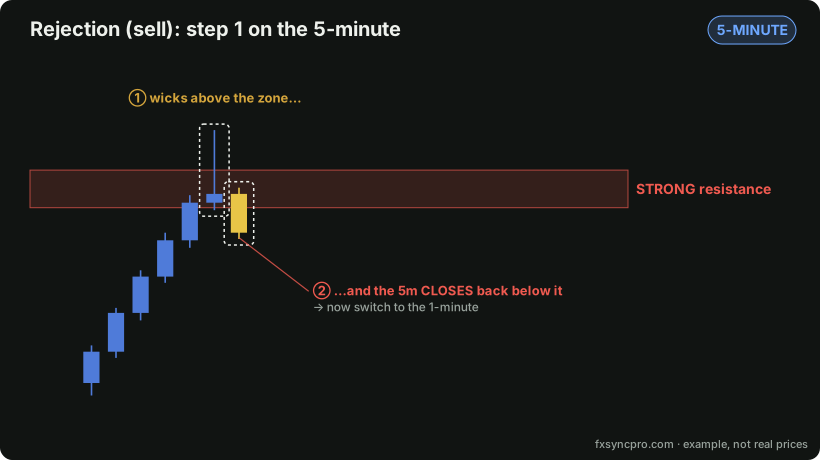 Only at STRONG levels. The wick above shows buyers tried and failed.
- Price wicks into or through a strong level.
- A 5-minute candle closes back on the other side. Now switch to the 1-minute.
Step 2, on the 1-minute: the entry.
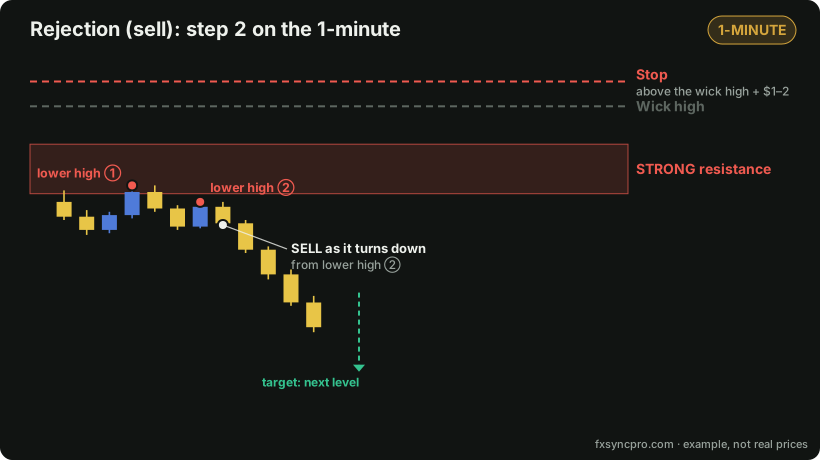 The 1-minute: a lower high below the zone, stop above the wick.
- Enter on the 1-minute lower high (sell) or higher low (buy). The stop goes a dollar or two above the nearest swing high, usually the rejection wick. If price wandered around the zone first, use the last lower high before the drop, not the very top of the zone.
Part 3: Stops and targets
Where the stop goes
- Beyond the retest or rejection candle AND the nearest swing high/low, plus $1–2 of breathing room.
- Never exactly on the level. A normal retest wick will take you out. It happened to me: my stop sat exactly on the level price was retesting, and the wick took it before price carried on in my direction.
- On gold that usually means $4–8 of risk. If the logical stop is further than about $8, I either halve my risk or skip the trade.
Where the target goes
- At the next real level, placed a little before it. Price often turns at the edge of a zone and never reaches the middle.
- Never “2× the risk into empty space”. If there’s no level there, there’s no reason for price to stop there.
- Room-to-target rule: the first target must be at least 1.5× the stop distance, with no strong level in the way. If it isn’t, I skip it.
Managing the trade
- Trail the stop behind each new 1-minute lower high (sells) or higher low (buys), a dollar or two beyond it, not right on it.
- Breakeven only once price has broken the next swing. I moved a stop to breakeven too early on 28 September; a normal $4 pullback tagged it to the cent, then gold fell another $6 without me.
Part 4: When I stay out
Knowing when not to trade has saved me more money than any entry.
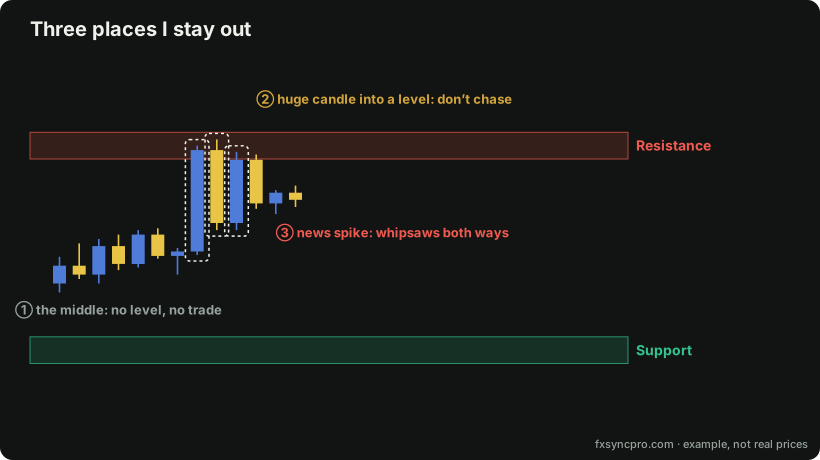 Most losing trades I’ve taken in the past came from one of these three.
- The middle. No level, no trade.
- Huge candles. I measure candles wick to wick. If the signal candle is more than about 1.5× the average of the last 14 five-minute candles (roughly $8 in quiet sessions, $10–11 in a busy New York session), I skip it. You’d be entering late with a huge stop.
- The New York open. No trades from 14:30 to 14:45 UK. Let the first three 5-minute candles settle. On 28 September a textbook break at 14:30 reversed $22 inside those 15 minutes.
- High-impact news (CPI, PCE, jobs/NFP, Fed decisions): no new trades from 15 minutes before to 15 minutes after, and wait for the second 5-minute candle after the release. I check the calendar before every session.
- No pullback, no trade. If price breaks and runs without retesting, I let it go. Chasing gives the worst entry right before the bounce.
- Three losses and I’m done for the day. No revenge trading.
A real example: 28 September, London session
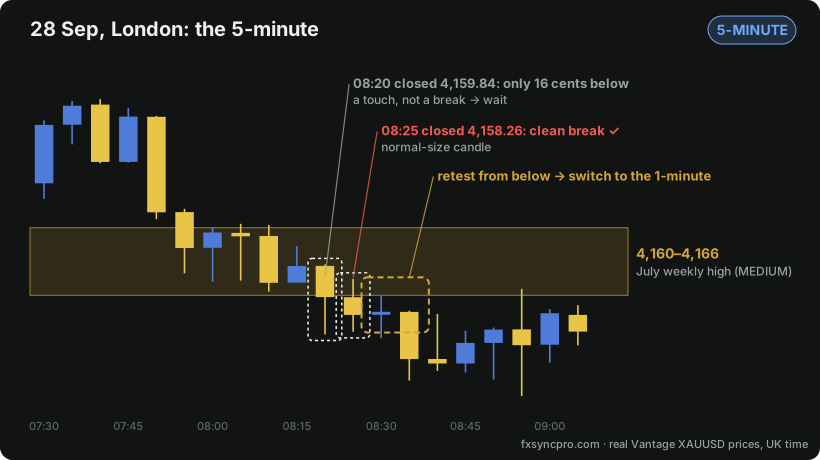 The 5-minute, real prices: the fake break I waited out, the clean break, and the retest.
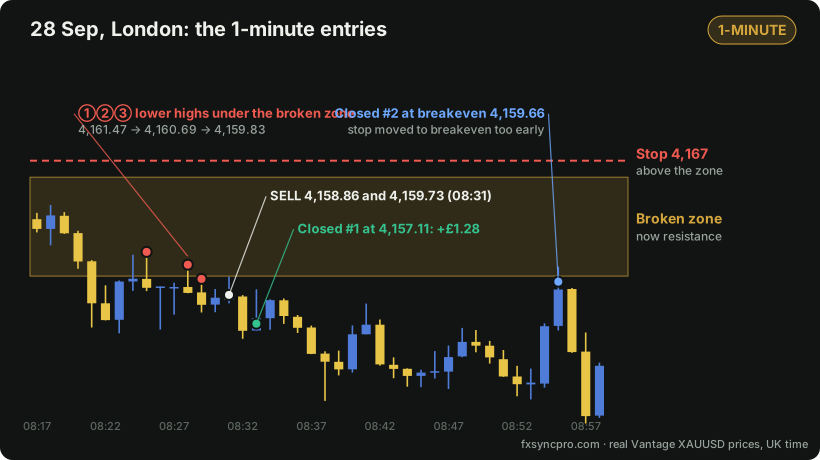 The 1-minute, real prices: the lower highs, both entries and both exits.
- The level: 4,160–4,166, the July weekly high, rated medium. Buyers had defended it for about half an hour.
- The first “break” was fake: a 5-minute close at 4,159.84, just 16 cents below. That’s a touch, so I waited.
- The real break: the next candle closed at 4,158.26, a normal-sized candle.
- Entry: price retested the zone and the 1-minute made lower highs. I sold twice, at 4,158.86 and 4,159.73, with the stop above the zone at about 4,167.
- Result: I took the first off early for a small profit, and the second was stopped at breakeven (too early, see above). A small win, and a lesson.
Later that day in New York I skipped five setups that broke one rule or another, and none of them would have been worth it. They’re all in the journal entry with the reasons.
The rules, in one list
- Mark up levels before the session, from the daily and weekly charts, weeks to months back.
- Use zones, not single lines.
- Rate every level strong, medium or weak. Only trade strong or medium.
- The live high/low price is sitting on is not a level yet.
- Only two setups: break and retest, or rejection at a strong level.
- Only closed 5-minute candles count, and they must close clearly through (about $1.50 on gold).
- Enter on the 1-minute lower high / higher low, never on the 5-minute close itself.
- Stop beyond the retest candle and the nearest swing, plus $1–2. Never on the level.
- Target the next real level, placed just before it. First target at least 1.5× the risk.
- Skip huge candles (more than about 1.5× the normal candle size).
- No trades 14:30–14:45 UK or 15 minutes either side of big news.
- No pullback, no trade. Don’t chase.
- Breakeven only after the next swing breaks. Trail behind 1-minute swings.
- Small size (I trade 0.01 lots, see what 0.01 lots really means on gold) and stop after three losses in a day.
Follow along
I post my levels before each session and the result of every trade, including the losses and the skipped trades. If you want to see whether this actually works over the next 100 trades, the newsletter sends the levels to your inbox, and the journal has everything so far.
This is my own method and my own trading, not financial advice. Trading CFDs and forex is high risk, and most retail traders lose money. Never risk money you can’t afford to lose.