Why my take-profit didn't trigger (and how to stop it happening to you)
By Jason · 5 October 2026
On Saturday I was short Bitcoin with a take-profit at 84,707.38. My chart showed price dropping to 84,691, a full $16 past my target.
The take-profit didn’t trigger. The trade stayed open.
My first thought was that my internet had dropped during my flight. It hadn’t mattered: stops and take-profits set from TradingView sit on the broker’s server, not your phone. The real reason is something almost every trader runs into, and once you see it you’ll never set a take-profit the same way again.
There are two prices, and your chart only shows one
At any moment your broker quotes two prices:
- Bid: the price you can sell at.
- Ask: the price you can buy at. It’s always a little higher.
The gap between them is the spread. It’s how the broker gets paid.
Here’s the catch: your chart shows the bid. The ask is invisible unless you switch it on.
Which price closes your trade
A trade always closes by doing the opposite of how it opened:
| Your trade | Opens at | Stop loss and take-profit fill at |
|---|---|---|
| Buy | the ask | the bid (what the chart shows) |
| Sell | the bid | the ask (chart + spread, invisible) |
So for a buy, what you see is what you get: your stop and target fill when the chart line touches them.
For a sell, your stop and target fill when the ask gets there, and the ask sits one spread above the line on your chart.
What happened to my trade
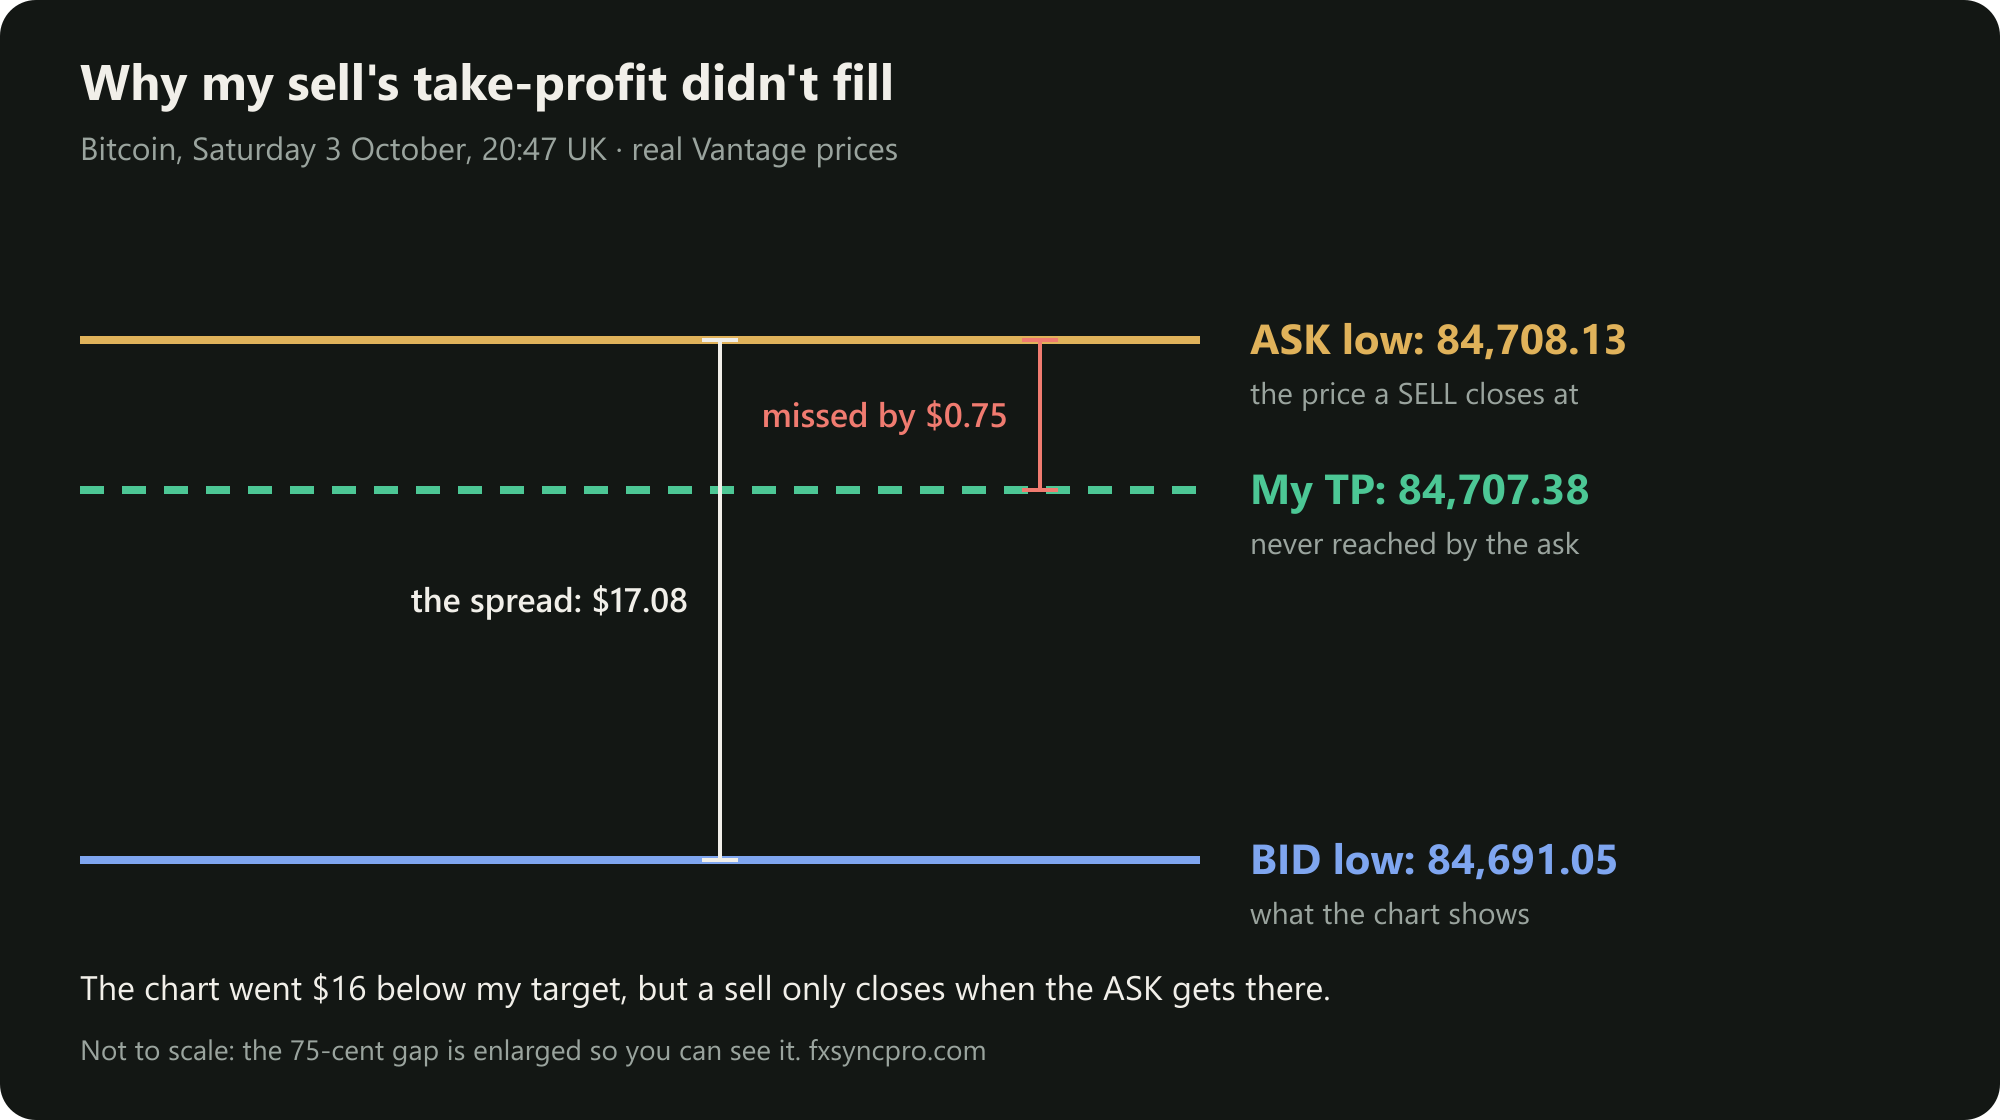 Not to scale: the 75-cent gap is enlarged so you can see it.
- The chart (bid) fell to 84,691.05.
- At that same moment the ask was 84,708.13, a spread of $17.08.
- My take-profit was 84,707.38.
The ask stopped 75 cents short of my take-profit. My chart said “target hit”. My broker said “not yet”. Both were right.
I moved the take-profit up to allow for the spread, and later that evening it filled at 84,746.87 for about 0.8R.
How to calculate the spread properly
1. In price: ask minus bid. On TradingView, the Sell and Buy buttons at the top of the chart show both prices, with the spread written between them. On my gold chart the other day:
Sell 4,165.44 · Buy 4,165.55 → spread = 4,165.55 − 4,165.44 = $0.11
2. In points, pips or ticks. Divide the spread by the size of one unit:
| Spread | Points (0.01) | Pips | |
|---|---|---|---|
| Gold (XAUUSD) | $0.11 | 11 points | 1.1 pips (1 pip = $0.10) |
| Bitcoin (BTCUSD) | $17.03 | 1,703 points | 17 pips (1 pip = $1) |
MT5’s Market Watch shows the spread in points (right-click → Columns → Spread), so on gold “11” means $0.11.
3. In money: spread × your position size. This is what every trade costs you the moment it opens: you start slightly negative by exactly this amount.
| Trade | Calculation | Spread cost |
|---|---|---|
| Gold, 0.01 lots (1 ounce) | $0.11 × 1 | $0.11 |
| Gold, 0.10 lots (10 ounces) | $0.11 × 10 | $1.10 |
| Bitcoin, 0.04 lots (0.04 BTC) | $17.03 × 0.04 | $0.68 |
4. Check how much it moves. On my broker last week the spread barely changed: gold was $0.11 almost all the time (highest $0.18, and only $0.14 even during the jobs report), and Bitcoin was $17.03 (highest $17.12). Many brokers widen the spread a lot at the daily rollover (around 22:00 UK) and during big news. Look at yours at those times before you rely on a number.
The fix
For sells:
- Take-profit: set it one spread above your real target, plus a small margin. Gold: about $0.20–0.30 above. Bitcoin: about $20 above.
- Stop loss: the same problem works against you here. A sell’s stop fills when the ask reaches it, so you can be stopped out while the chart still shows price below your stop. Add the spread to your stop distance.
For buys: nothing changes. Stops and targets fill at the bid, the price on your chart.
Better still, show the ask on your chart. In TradingView: chart Settings → Symbol → Bid and ask → turn on the ask line. Then for a sell you can see exactly where your order will fill.
The short version
- Your chart shows the bid.
- Sells close at the ask, one spread higher.
- Spread = ask − bid. Work it out in money as spread × position size.
- Set sell targets and stops one spread further than the chart says.
It cost me 75 cents of distance and a few hours of waiting to learn it properly. Hopefully this saves you the same.
Every trade I take is in my journal, including this one on 3 October. For sizing trades by risk, see how to size a Bitcoin trade.
Real trades on my own live account at small size. This is how I trade, not financial advice.